
Self storage always has been (and probably always will be) hyper local. Market dynamics can look very different depending on your zip code.
And in a growing number of cities across the country, the impact of oversupply is becoming impossible to ignore.
After the historical heights of COVID, too much storage is now competing for the same pool of tenants, putting pressure on rents, occupancy, and lease-up performance. It’s important to recognize that oversupply is a market condition, not a management failure, and understanding the underlying causes is the first step to navigating it well.
Here is a closer look at how the market arrived at its current state, where oversupply is most acute, and what it actually means for operators on the ground.
When the pandemic hit in 2020, self storage was one of the few real estate sectors that held up. Demand surged, occupancy climbed, and street rates rose sharply across the country.
In 2021 and into 2022, the major REITs were posting double-digit same-store revenue growth, and the narrative around the asset class was that self storage was recession-resistant, pandemic-proof, and undersupplied in many major markets.
Developers and investors sprung into action.
With demand strong, borrowing costs still relatively low heading into 2022, and cap rates compressing, the economics of new development looked compelling in market after market.
But then things began to change. The Fed began raising rates aggressively in 2022, cooling both housing turnover and consumer mobility, which are two of the biggest demand drivers for storage. The demand tailwinds that made all that new development look so promising started to fade just as a wave of new supply was about to hit the market.
By 2023 and into 2024, the new supply that had been set in motion began arriving in force. Markets that had been undersupplied were now receiving multiple new facilities at once. Occupancy softened. Street rates, which had reached historically elevated levels, began to fall.
That is the environment operators and investors are navigating right now. The oversupply showing up in Atlanta, Dallas, Tampa, and elsewhere is not an accident. It is the culmination of a development cycle that collided with a demand environment which turned out very different than anyone projected.
While no single metric tells the whole story, there are several indicators that tend to appear when supply starts outpacing demand:
When asking rents are falling consistently across a market, not just at one facility or one unit type, that is a supply signal. A single facility dropping rates to stay competitive is a localized pricing strategy. But multiple facilities doing the same thing at the same time is a signal that the market may be adjusting to more inventory than demand can support.
One facility struggling to fill units could point to a management, marketing, or pricing issue. But when occupancy is soft across multiple facilities in the same geography, the problem is likely bigger than any one operation.
For example, if your facility is hovering around 75% occupancy and nearby competitors are in a similar position, the market may simply have more units available than it has people actively looking to rent them.
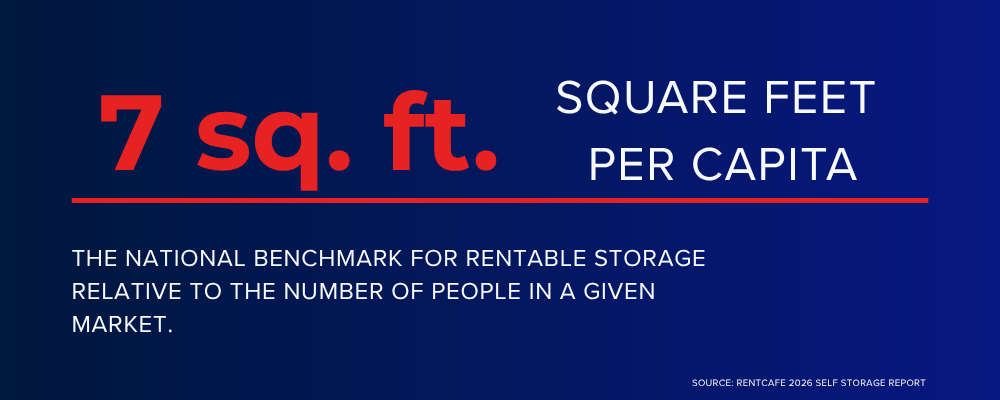
Square footage per capita measures how much storage space exists relative to the number of people in a given area.
According to RentCafe's March 2026 self-storage report, the national benchmark sits at around 7 square feet per capita.
Markets running significantly above that number have more storage than their population typically needs, and operators in those markets are all competing for a smaller slice of available demand.
New supply still under construction is supply that has not started competing yet. If a market already has occupancy and rate pressure, and there are several new facilities still months from opening, the situation is likely to get more competitive before it improves.
Pipeline data is available through CoStar, Yardi Matrix, StorTrack, and local permit filings. As a rough rule of thumb, if a market's pipeline represents more than 5–7% of existing inventory and the market is already showing rate or occupancy softness, you need to proceed with caution before making acquisition or development decisions.
In markets that overbuilt meaningfully, the absorption cycle typically takes two to four years from peak delivery volume to a healthier supply-demand balance. That timeline can compress if population growth is strong or demand drivers pick back up. But it can take longer if the construction pipeline stays active longer than expected or if broader economic conditions weaken household formation.
Once you know the signs of oversupply, the next question is where those signs are actually showing up.
The markets below are not a blacklist. Many of them have strong population bases, real demand, and long-term growth potential. But right now, the balance between supply and demand in these areas has shifted enough that operators and investors need to be paying closer attention than they might have a few years ago.
Last Updated June 2026. The information below is compiled from publicly available sources and updated on a regular basis. Market conditions and supply dynamics can change quickly, and some figures may have shifted since this was last updated. This is intended as a starting point for research, not a substitute for direct market analysis or consultation with a qualified real estate professional.
The table gives a broad view of the markets showing oversupply pressure, but a few stand out because they show how different this issue can look from one market to the next.
ATL is a case of volume. The metro recorded some of the steepest rent declines among major markets, with year-over-year drops ranging from 8 to 15 percent depending on the measurement period, driven by 2.4 million square feet of new deliveries in 2025 alone.
When that much supply enters a market in a short window, even healthy demand struggles to keep pace. Operators in Atlanta are not just competing with one or two new facilities. They are competing with a wave of them, all trying to lease up at the same time.
Cape Coral tells a different story, one about what happens when the pipeline has not finished delivering yet. Its 2026 construction pipeline represents a 15 percent increase to existing inventory, the most aggressive expansion relative to existing stock among the top markets nationally according to RentCafe's March 2026 report.
Street rates are already declining, which means the market is absorbing pressure now, before the full weight of new supply has even arrived. For operators already in Cape Coral, the competitive environment is likely to get more crowded before it gets easier.
Dallas-Fort Worth is a longer term supply scenario. It is the largest self-storage market in the country by total inventory, sitting at more than 10 square feet per capita, well above the national benchmark.
The market recorded approximately 9.5 percent rent declines year-over-year, not because of a sudden surge in new development, but because years of accumulated supply have left it with more storage than its demand base can support at previous rate levels.
Dallas is a reminder that oversupply does not always arrive all at once. Sometimes it builds gradually until the market can no longer absorb it quietly.
The right response to oversupply depends heavily on which seat you’re sitting in. The playbook for an operator running a stabilized facility looks different from the playbook for an investor evaluating an acquisition.
Your primary job in an oversupplied market is to protect what you have built. Move-outs are expensive when replacing tenants is harder than it used to be, so retention should be a real priority — not just a talking point. Proactive communication, responsive service, and modest loyalty incentives can meaningfully reduce turnover in ways that show up directly on your NOI.
On pricing, resist the instinct to drop street rates aggressively to chase occupancy. Rate cuts are easy to make and hard to reverse, and competing primarily on price in a market where everyone is cutting rates is a race you cannot win cleanly.
A more sustainable approach is to compete on value, e.g., cleaner facility, better customer experience, faster response times, stronger online presence, while making smaller, data-driven adjustments rather than broad cuts.
Oversupplied markets are not uninvestable, but they require a different underwriting mindset. The mistake most buyers make in a soft market is anchoring pro forma assumptions to what the market looked like during the peak. Do not project street rates and lease-up timelines that made sense in 2021 when they do not reflect the environment you are buying into today.
Start with conservative rate assumptions. If street rates have been declining, underwrite to current rates, not to a recovery you are hoping for. Also, build in longer stabilization timelines. A facility that might have hit 90% occupancy in 12 months in a healthy market may take 18 to 24 months in an oversupplied one.
Make sure your debt structure can support that extended runway without creating a liquidity problem.
Oversupply is not a permanent condition, and it does not mean a market is destined to underperform forever. In fact, industry data shows the supply pipeline is slowing, which should lead to less new construction in the coming years.
But operators still have to manage through the pressure while that shift is happening.
That is where operational excellence matters. In oversupplied markets, the goal is to protect performance with smarter pricing, stronger lead follow-up, better expense control, and a clear understanding of where demand is actually coming from.
As a storage management company, we help owners navigate changing market conditions with data-driven strategies, operational discipline, and a clear understanding of what is happening at both the facility and market level. Whether you are evaluating a new acquisition or looking to improve performance in an increasingly competitive market, having the right information and the right team can make all the difference.