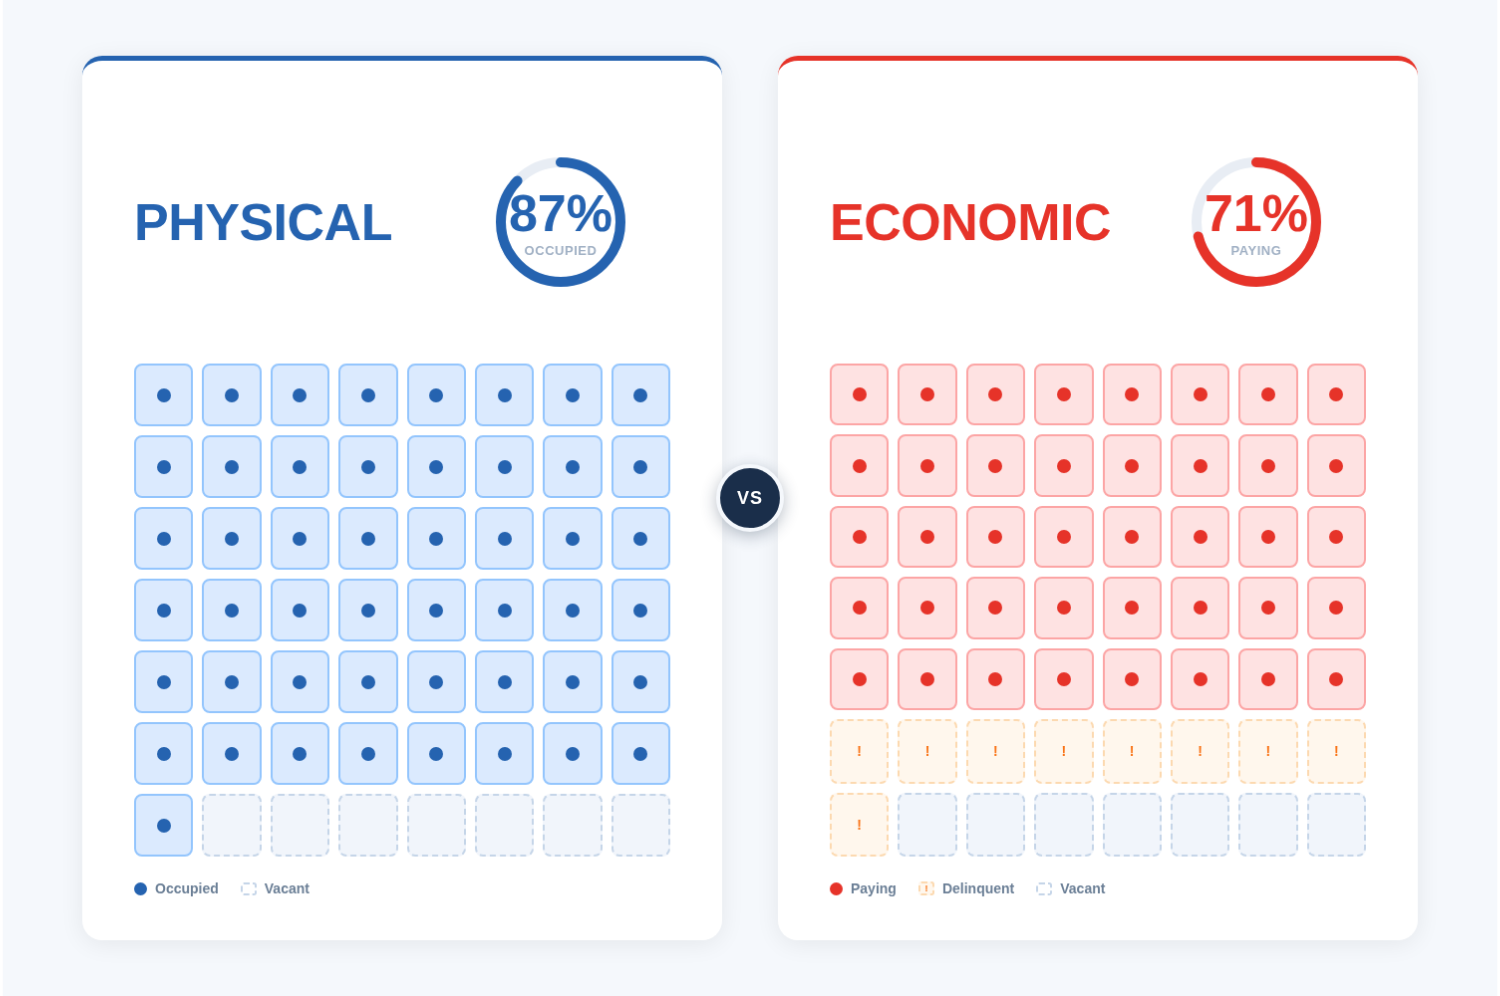
Every self-storage facility has two occupancy numbers: physical and economic.
Most owners only pay attention to physical occupancy, but it’s economic occupancy that tells the real story of how profitable your facility is operating.
This is one of the most common blind spots in self-storage. Most owners know the first metric well. Fewer track the second one closely enough. And the gap between them is often where revenue goes to hide.
The good news is that it's a very solvable problem; whether you're an investor underwriting a potential acquisition or an operator managing a facility day to day, understanding both metrics, and the relationship between them, changes how you evaluate performance and where you focus your energy
Physical occupancy is the most commonly referenced metric in self-storage, and the math behind it is straightforward. Take the number of rented units, divide by the total number of units available, and you have your physical occupancy rate.
A 200-unit facility with 180 rented units is running at 90% physical occupancy.
What that number tells you is how much of your space is being used. It's a utilization metric, and it's a useful one.
Generally speaking, a physical occupancy rate of 85% or higher is considered healthy in self storage. Rates above 90% signal strong demand and put an operator in a position to push rents. Anything consistently below 80% warrants a closer look at pricing, marketing, or local market conditions.
For operators it's a reliable day to day pulse check on how well the facility is connecting with its market. For investors it's an early signal of asset health and a starting point for underwriting.
However, where physical occupancy falls short is in telling you how well that space is performing financially. A unit that's rented is counted the same whether it's paying full market rate or a rate that hasn't been touched in three years.
Discounted units, delinquent tenants, and legacy pricing all show up the same way on a physical occupancy report. The number looks clean even when the revenue story underneath it isn't.
That's the limitation. Physical occupancy tells you your facility is full. It doesn't tell you’re actually operating in a profitable way.
If physical occupancy tells you how much of your facility is rented, economic occupancy tells you how much of your facility's potential revenue you're actually collecting.
That distinction is everything.
The formula is straightforward: take your actual rental income collected and divide it by the potential rental income if every unit were rented at the current market rate. The result is your economic occupancy rate, and it paints a very different picture than your unit count alone.
Consider that same 200-unit facility with 180 units rented — a clean 90% physical occupancy rate. On paper, that looks like a well-performing asset.
But when you look closer, 40 of those tenants have been there for several years and are paying rates that haven't kept up with the market. Another 15 units are sitting in various stages of delinquency. And a handful of new move-ins came in on promotional discounts that are still active.
The units are occupied. The revenue, however, tells a different story.
That same facility might be collecting only 76% of what it could be earning at current market rates — meaning its economic occupancy is sitting 14 points below its physical occupancy.
That difference exists because of a handful of common and often overlooked revenue drains:
None of these challenges are unusual. Every facility deals with some version of them. Economic occupancy makes them visible. It captures how profitably a facility is being managed, not just how full it happens to be, and it gives owners and investors a far more honest picture of where revenue actually stands.
The occupancy gap is simply the spread between your physical occupancy rate and your economic occupancy rate. In a well-run facility, a small gap of around 1 to 3% is completely normal.
Promotions happen, turnover creates brief delinquencies, and the occasional legacy tenant is part of operating any asset over time. A small gap isn't a red flag. It's a reality of the business.
But when that gap widens — say physical occupancy is sitting at 90% and economic occupancy has drifted to 76% — you're no longer looking at a normal variance. You're looking at revenue leakage, and it compounds quietly over time.
Here's what that looks like in real numbers. Take our 200-unit facility. Assume the average market rate for a unit is $150 per month.
At 90% physical occupancy, the facility has 180 rented units. At full economic performance on those 180 units, that's $27,000 in monthly gross revenue. But at 76% economic occupancy, the facility is only capturing about $22,800 per month.
That's a difference of roughly $4,200 every single month, or just over $50,000 annually — not from vacancy, but from underperforming occupied units.
That number matters far beyond the income statement. When a lender or buyer underwrites a self-storage asset, they're forecasting operating income, not utilization.
A facility with strong physical occupancy but weak economic occupancy will appraise lower, finance harder, and sell at a discount compared to a facility that has closed the gap.
Improving economic occupancy without adding a single unit can meaningfully move the needle on asset valuation, which is why sophisticated investors have started treating it as a core underwriting metric rather than an operational afterthought.
Identifying the occupancy gap is one thing. Closing it is where the real work happens, and it comes down to four operational levers:
Knowing what your units are renting for is not the same as knowing what they should be renting for. Regularly comparing your in-place rents to current street rates in your market is what prevents pricing drift from quietly compounding over months and years. Without that consistent market research, it's easy to fall a year or two behind the market without ever realizing it.
One of the most common drivers of a widening occupancy gap is legacy pricing — tenants who moved in at a lower rate and have never been brought up to market. A systematic approach to rent increases, applied consistently across your tenant base, keeps that gap from forming in the first place. It also makes rate increases feel less arbitrary or reactive, because they become a regular part of how the facility operates.
Delinquent tenants are one of the main contributors to the occupancy gap because they inflate your physical occupancy while dragging your economic occupancy down. An occupied unit that isn't paying is not a performing unit, and staying on top of delinquency early prevents small collection issues from becoming larger revenue problems.
Tools like StorBill, a solution for delinquent payments, can streamline the collections process and help operators stay ahead of delinquency before it becomes a larger revenue problem.
Move-in promotions are a legitimate and effective tool for driving occupancy, but untracked or extended discounts quietly erode revenue performance over time. First month free promotions are one of the most common examples — a popular incentive that can work against you if the terms aren't clearly defined and consistently enforced.
Being intentional about how discounts are structured, how long they run, and when they expire is what keeps promotions working for the facility rather than against it.
Economic occupancy isn't a complicated concept, but consistently managing it requires the right data, the right systems, and the discipline to act on both. That's not always easy to maintain in-house, and it's one of the reasons the gap exists at so many facilities in the first place.
The self-storage owners and investors who build lasting equity aren't just chasing high unit counts. They're paying attention to what those units are actually producing, and they're making operational decisions that close the gap between what a facility is doing and what it's capable of doing.